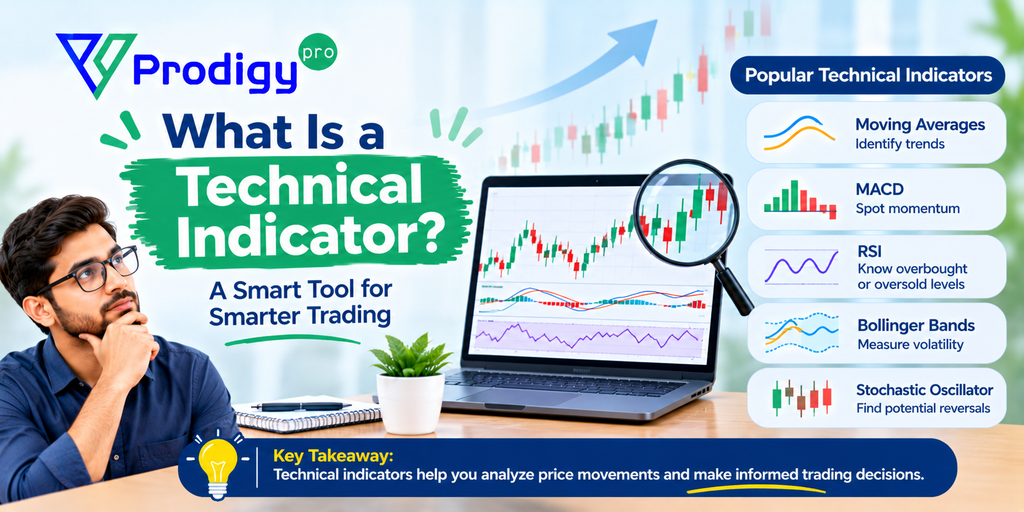
If you have been dealing with the stock market for a long time, we hope you have heard about technical indicators previously. But what about the beginners? Are you all aware of them? We have seen people asking if it is a magic formula to make money in the share market. Well, not exactly! It’s just an essential and extremely powerful tool that helps traders make more informed decisions to gain profit. In this blog, we will discuss the meaning, examples, types, and how it exactly works.
What Is A Technical Indicator?
Simply put, a technical indicator is a mathematical calculation based on price, volume, or open interest data that a trader generally uses to analyse the financial market. It helps traders to check past price fluctuation and predict the future trend.
These indicators guide traders and investors through the ups & downs of the market. It cannot be compared with fundamental analysis, as they completely depend on historical price and volume data, whereas fundamental analysis is dependent on companies’ economic factors and financial health.
Importance of a Technical Indicator
There are a lot of benefits to using technical indicators before making any purchase in the stock market. Here we are mentioning four things that makes it the most important tool,
- It provides signals to the traders to initiate a potential buy and sell.
- Technical indicators help in making decisions as they offer data-driven insights.
- They help in setting stop-loss and take-profit levels to assist a trader in managing risk.
- Traders can identify market trends using technical indicators. For example, downtrend, uptrend, and sideways market.
Types Of Technical Indicators
Every category of technical indicator has its own types.
Momentum Indicator
This category of Technical indicators helps traders measure the speed and strength of every price fluctuation. Momentum indicators have three types,
- RSI (Relative Strength Index)
RSI helps in identifying overbought and oversold conditions of any financial instrument.
- Stochastic Oscillator
It helps traders compare particular closing prices over a specific time frame.
- MACD ( Moving Average Convergence Divergence)
It helps in identifying the relationship between two moving averages.
Trend Indicator
These technical indicators help the traders and the investors to determine the overall direction of the stock market. It is also divided into three types:
- Moving Average
To identify the trend, the moving average smooths out price data.
- Parabolic SAR
Parabolic SAR is most useful in trending markets and can give false signals in sideways markets.
- ADX (Average Directional Index)
It gives direction to traders or investors by measuring the strength of a trend.
Volume Indicator
This is also a very essential technical indicator as it helps in analysing the volume and understanding the strength of the market. The volume indicator is divided into two types:
- VWAP (Volume Weighted Average Price)
Based on volume, this indicator helps in determining the average price.
- OBV (On-Balance Volume)
The responsibility of this indicator is very simple, as it only measures the buying and selling pressure.
Volatility Indicator
Volatility indicators show how the price of an asset fluctuates over a particular time frame. Volatility indicators are divided into two types:
- Bollinger Bands
Bollinger Bands measure the volatility and potential overbought or oversold level of the market.
- ATR (Average True Range)
ATR only measures market volatility.
How Technical Indicators Work
By now, we hope you must have got an overall idea about the purpose of using technical indicators. Now it’s time to understand how they work.
- Step 1 includes data collection. Technical indicators are fully dependent on market data, for example, closing prices, volume, moving averages, and others.
- Step 2 is all about calculation. Every technical indicator has a unique formula using the data.
- Step 3 is interpretation. Once the calculation is over, traders or investors will understand whether an asset is oversold or overbought, try to learn about the trend of the market, and check the volatility.
- Step 4 is decision-making. Depending on the results of Technical indicators, traders decide to purchase or sell their holdings.
Final Thoughts
In most cases, technical indicators provide valuable insights to traders and investors, but they should be used wisely. Avoid relying on a single indicator; instead, combine multiple indicators with other forms of analysis, such as fundamental analysis and price action, for better results.
Please share your thoughts on this post by leaving a reply in the comments section. Contact us via Phone, WhatsApp, or Email to learn more about mutual funds, or visit our website. Alternatively, you can download the Prodigy Pro app to start investing today!
Disclaimer – This article is for educational purposes only and does not intend to substitute expert guidance. Mutual fund investments are subject to market risks. Please read the scheme-related document carefully before investing.
FAQs
- What are the most popular technical indicators in action?
The most popular technical indicators are the moving average for identifying the trend, RSI to understand the overall market condition, and lastly Bollinger Bands for understanding the volatility of the market.
- What is the difference between leading and lagging indicators?
Leading indicators like Stochastic and RSI can predict potential price movement, whereas lagging indicators like MACD and moving averages can confirm the trend of the market.
- Do beginners use technical indicators?
For beginners, using RSI and moving averages is always recommended. Slowly, they can start exploring advanced tools.
- Can technical indicators predict the future of any asset?
No, using technical indicators, traders or investors can get a probability or signal, but it cannot guarantee future price fluctuations.
- In technical analysis, what is divergence?
Divergence happens when an asset’s price moves against an indicator, such as the RSI or MACD. It might indicate a possible reversal in the trend.