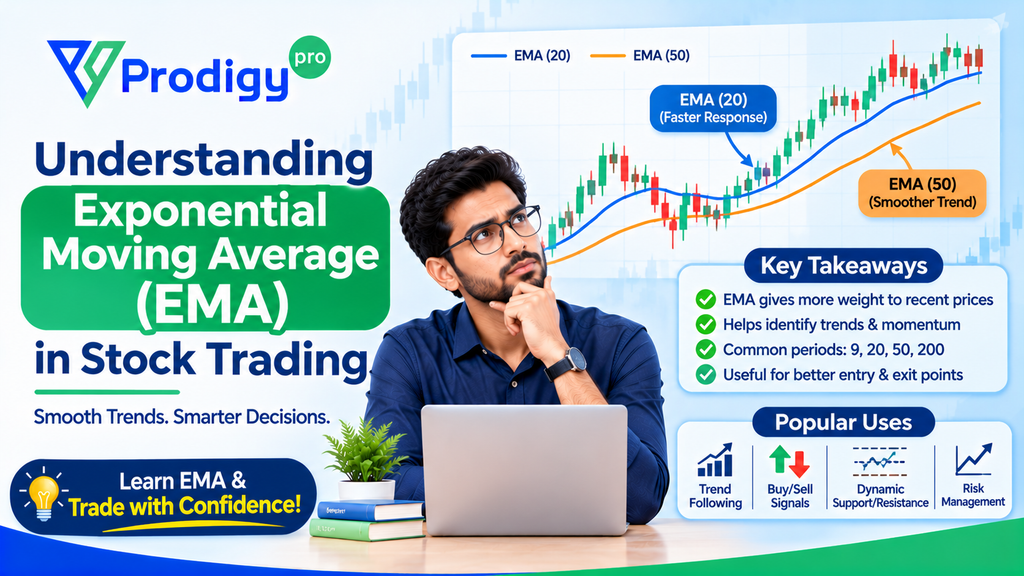
To become a successful trader, it is important to understand market trends and identify potential price movements. In several technical analysis indicators, perhaps the most valuable one is Exponential Moving Average or EMA.
We know the term may puzzle you a bit, but worry not, we’ll explain what EMA is, how to use it, its benefits and drawbacks, and how to use it properly in stock, FX, and cryptocurrency markets in this blog post.
An Exponential Moving Average (EMA): What is it?
The Exponential Moving Average (EMA) is a type of moving average that gives greater weight to recent price data. This renders the EMA more responsive to newer price data compared to a normal Simple Moving Average (SMA).
In EMA used in stock trading, the traders use the indicator to smooth out the price action and highlight the direction of the underlying trend. The sensitivity of EMA makes it very useful when the market is highly volatile, enabling the traders to quickly respond to possible changes.
EMA can be used on all market types, commodities and stocks, forex and cryptocurrency, so it is a convenient tool to have in any trader’s toolkit.
How to Calculate EMA
Although at first glance the calculation formula for the EMA might look complicated, it’s easy when you dissect it.
The Formula for EMA Breakdown
EMA = (Current Price – Last EMA) × Multiplier + Last EMA
The Multiplier is the smoothing constant and is calculated with:
Multiplier = 2 ÷ (Time Period + 1)
For example, to find a 10-day EMA, the multiplier will be:
2 ÷ (10 + 1) = 0.1818
Thus, the latest price will contribute about 18.18% to the new EMA value.
Role of the Smoothing Constant
Smoothing constant is very important as it will determine the responsiveness of the EMA to latest price actions. Higher weighting of recent prices will make the EMA react more quickly, which is required for highly volatile markets like crypto or highly volatile stocks .
EMA vs. Simple Moving Average (SMA): Major Differences
Comparing EMA vs SMA, it is very important to know how both function.
- SMA: Looks at the period average of the closing prices and gives equal weights to all points.
- EMA: Gives greater weight to recent prices, making it more responsive to market movements.
In volatile markets, the reactivity of EMA provides an edge, especially when urgent trading decisions are called for. This is why the majority of traders make use of EMA compared to other moving averages.
Common EMA Timeframes Used in Trading
Choosing a correct EMA time period is essential and largely driven by your style of trading and goal.
EMAs: Short-Term versus Long-Term
- Short-Term EMAs: Because they react quickly and are extremely sensitive to recent prices, intraday and swing traders most often utilize 9-, 12-, and 20-day EMAs.
- Long-Term EMAs: Investors utilize long-term EMAs, such as 50-, 100-, and 200-day EMAs, to obtain fundamental trend orientations.
While stock traders utilize both long and short EMAs to make better entry and exit decisions, short EMAs are more frequently used in forex and cryptocurrency trading due to the extremely high price volatility.
How Traders Use EMA While Making Decisions
EMA is not only a trend indicator, it’s a tactical tool that affects every aspect of the trading process.
Using EMA with Other Technical Indicators
Professional traders do not utilize EMA alone too frequently. It’s employed primarily in combination with other technical markers like RSI (Relative Strength Index), MACD (Moving Average Convergence Divergence), and Stochastic Oscillators to validate trading signals and avoid whipsaws.
EMA Crossover Signals
One of the most popular EMA trading methods is to search for crossover signals:
- Bullish crossover occurs when a short EMA (e.g., 20-day) crosses over a long EMA (e.g., 50-day), indicating a probable trend in the upward direction.
- Bearish crossover occurs when the short EMA goes below the long EMA, indicating a probable trend in the downward direction.
EMA crossover signals are subtle yet effective pointers to possible change in trends.
EMA for Trend Analysis
Applying EMA for trend analysis puts the traders on the right side of the market.
- If the price is consistently above the EMA, it generally reflects a trend of movement upward.
- If the price is below the EMA, it reflects a downtrend.
This simple interpretation can help traders avoid impulsive decisions.
EMA and Market Volatility
Markets are not usually stable, and EMA’s responsiveness enables the traders to manage market volatility more effectively. Compared to fixed tools, EMA responds along with the market, thus enabling real-time observations, which are of greatest significance in volatile environments.
Limitations of EMA and How to Overcome Them
Despite numerous advantages, EMA is not perfect.
EMA Shortcomings
- Lagging Indicator: Like any moving average, EMA is derived from historical prices and will thus lag during rapid market reversals.
- Whipsaws: In range-bound or sideways markets, EMA will produce false signals resulting in losses.
- Over-Sensitivity: Extremely short EMAs will over-react and provide noise instead of quality signals.
EMA Trading Tips to Counter Limitations
To counter these frailties:
- Utilize EMA signals in combination with price action analysis or other technical indicators.
- Use an EMA of longer lengths to reduce false signals.
- Always backtest your EMA trading systems on different market conditions before taking them live.
For newbies, starting from higher timeframes and slowly introducing more advanced EMA strategies like multi-timeframe analysis can prove to be enormously beneficial.
Final Thoughts
The Exponential Moving Average or EMA is a critical tool for serious traders since it provides valuable information about direction, momentum, and potential entry/exit points. Its sensitivity to current price action makes it a favorite among intraday stock, forex, and cryptocurrency traders.
But like all technical gadgets, EMA will work most effectively with a good trading strategy and sound risk management plan. Novice or seasoned trader, the time spent studying EMA will certainly hone your trading edge.
Please share your thoughts on this post by leaving a reply in the comments section. Contact us via Phone, WhatsApp, or Email to learn more about mutual funds, or visit our website https://bfccapital.com/ .
Alternatively, you can download the Prodigy Pro app to start investing today!
Disclaimer – This article is for educational purposes only and does not intend to substitute expert guidance. Mutual fund investments are subject to market risks. Please read the scheme-related document carefully before investing.
FAQs
1. What is the most popular EMA timeframe in stock trading?
50-day and 200-day EMAs are the most frequently used by stock traders to identify longer-term trends.
2. How do I use EMA crossover strategies best?
Watch out for short- and long-term EMAs crossover and back this up with other indicators such as RSI to eliminate false signals.
3. Is EMA reliable in ultra-volatile markets?
Even though EMA is more sensitive than SMA, using it alongside volatility indicators will introduce reliability in the midst of violent market fluctuation.
4. Can I use EMA to trade cryptocurrency?
Yes, EMA is very effective when trading in cryptocurrency because it can react to sudden price movement instantly.
5. Do new traders need to use EMA or SMA first?
New traders should begin with EMA because its quicker response to prices gives them more useful signals on which to practice and learn.